The ASMA Project
The ASMA Project |
|
|
The ASMA program is a C++ program running under 32 bit MS-Windows. It serves
as a data analysis front end to the ASM sedimentation
level meter. The program makes heavy use of the 32 bit features of Windows. Those
include multithreading as well as virtual memory and demand paging. The graphics
software uses OpenGL for the device independent rendering of the graphical output.
|
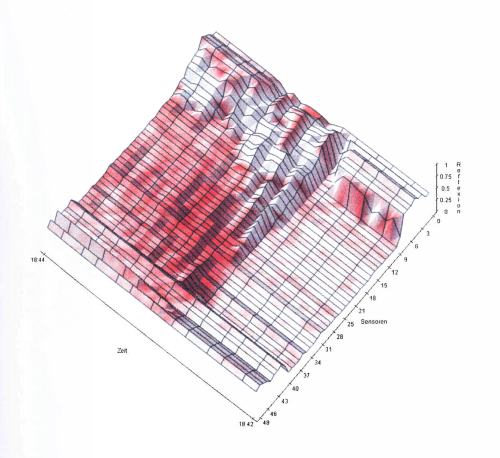
The image shows the outcome of a laboratory experiment in which the ASM is mounted
in a tank filled with sand and water. The amplitude is the reflection of the material
in front of the sensor while the color red is used do mark the variance of the
reflection. The time axis is from the back to the front, one line is half an hour.
The sensor number
from high to low is from left to right one line being one sensor.
The image shows a large amplitude to the right which is from the high reflection of the sand surrounding the lower sensors of the instrument. At the beginning of the experiment we use a pump to entrain some of the sand. The entrained sand reflects part of the light, approximately half as much as the solid ground. The movement of the sediment particles is shown through the high red variance of the reflection. Soon after switching off the pump the random movement ceases and resedimentation begins. It can be noticed, that after some latency resedimentation has an exponential time characteristic, being quicker farther away from the ground. In the middle of the experiment somebody knocks on the tank, leading to higher sand compression and the removal of some particles that stuck to the sensors. |
|
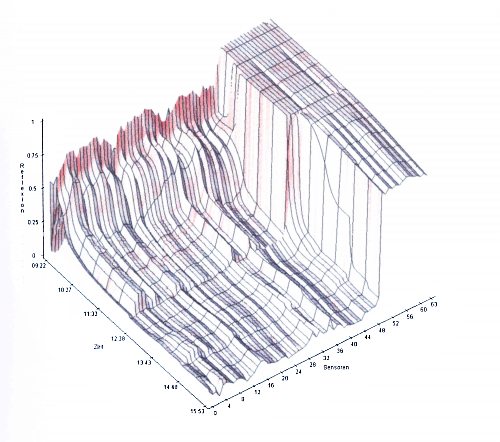
The next image shows an outdoor experiment where the ASM is installed in shallow
water. (See picture on the project page)
The scaling is different here, the high resolution time axis is from front to back,
one line is 10 seconds. The
sensor axis is from right to left, again one line is one sensor.
The instrument is in the sand on the left up to sensor 39, in the water from there up to sensor 8 and in the air above, on the right. Sensors have a higher reflection in air due to surface effects of the lenses. The variance of the reflection is amplified here and again displayed in red. In the beginning everything is calm, only very small surface waves around sensor 8 (red areas). Then a ship passes by, causing large water waves and sediment entrainment and movement (red). The waves even enter the ground and cause shifts of material there (left middle side of the image a little red were the high ground reflection is). After a little while the movement calms down and resedimentation leads to a lower material density in the water. |
|
|
|
Gerdes Systemtechnik
Mühlgraben 5 D-09669 Frankenberg Germany |
Phone:
Fax: |
xx49-37206-6009-20
xx49-37206-6009-24 |
|